I like to make stuff
© 2026. All rights reserved.
Hosted by Github
france
Read more →
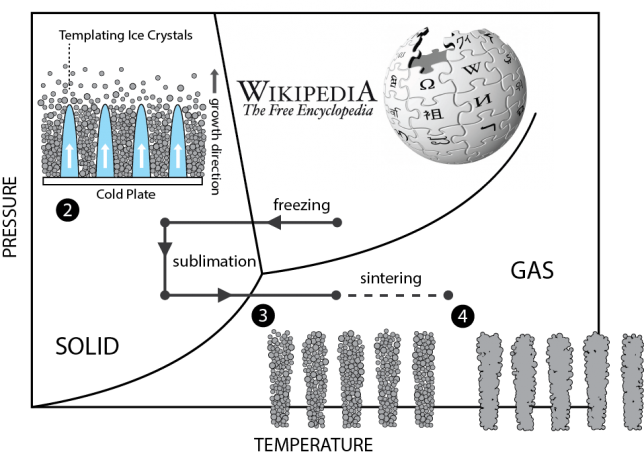
freeze-casting
materials
(https://en.wikipedia.org/wiki/Freeze-casting)
Boy does that feel good to say.
The Egg on the Bus
Café Gourmand: What it is and why we need it
 (https://en.wikipedia.org/wiki/Freeze-casting)