Analyzing the relationship between retail pot sales and call-center data
04 Nov 2015For years, the criminalization of Marijuana sale and usage has made data collection and research on the topic difficult to perform. In Washington state, Recreational Marijuana went on sale in local dispensaries starting mid-2014. The question of whether or not the opening of a dispensary produces a spike in the amount and type of Marijuana use is a valid question for legislators, administrators, doctors and more.
As an exploratory exercise, I created the following map using call-center data gathered by the Washington State Poison Center on marijuana use and data scraped from the web on the location and opening date of retail marijuana shops in Washington State. Data ranges from January 2014 to August 2015. Both calls and shops are localized by zip code. By scrolling through we can see where and when shops and cases cropped up.
“Cases” are any calls that went to the Washington Poison Center related to Marijuana usage. This could be anything from “My child got into my weed cookies” to a doctor calling to consult on someone who ingested too much Marijuana.
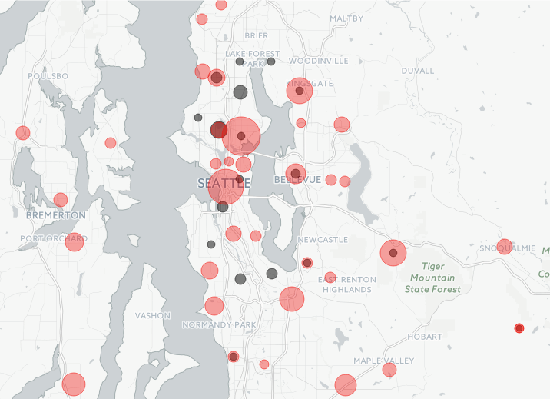
In this period of time there were only a few hundred cases. This was enough however to see some trends in the data. The highest number of cases occurred in the U District and in Pioneer Square.
Please note that currently only shops in KING COUNTY are shown.
This map was created using R, Leaflet, and Shiny.