Week 6 / 7: Unsupervised Methods, Recommenders and Break Week
10 Jul 2016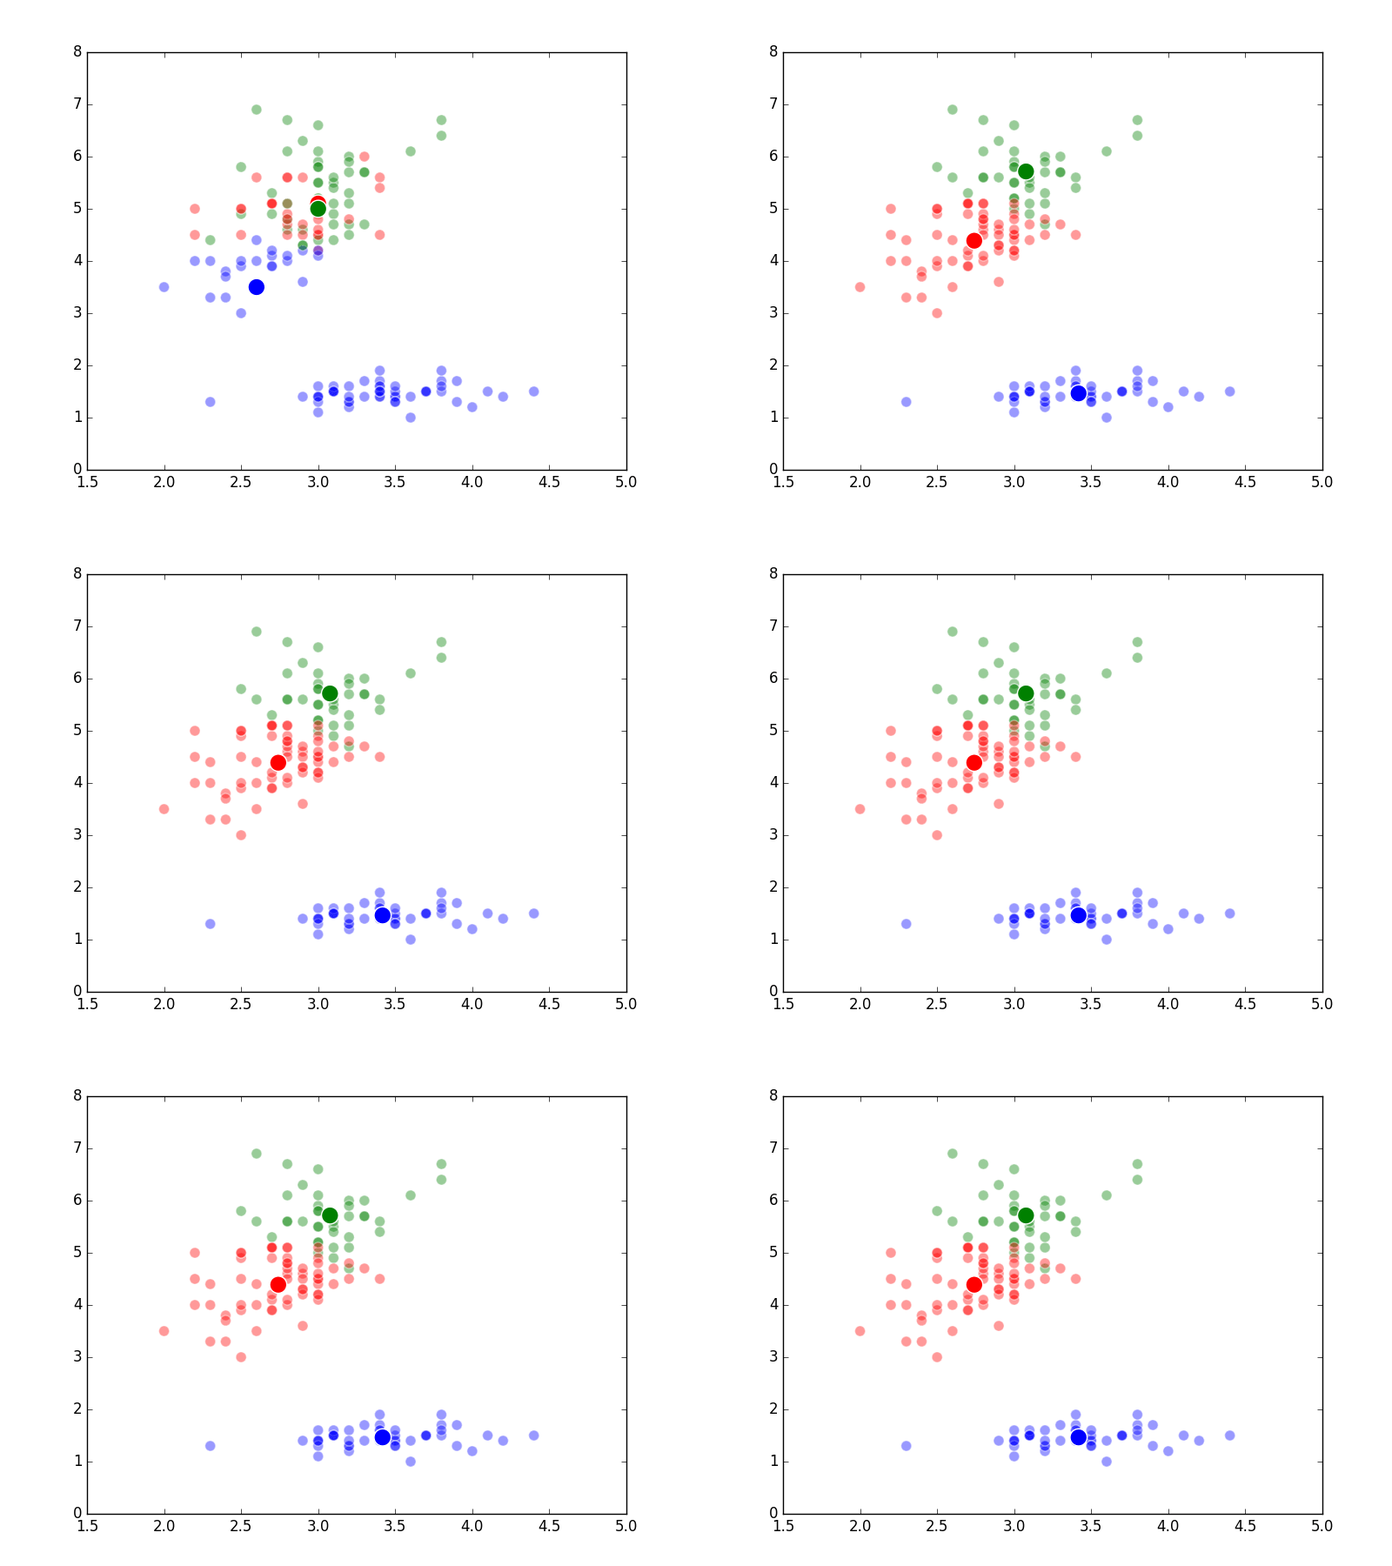
Unsupervised Methods
Well, it’s the end of break week, that’s why there wasn’t a post last Sunday. In the beginning of Week 6, we studied what are known as “unsupervised methods”. These methods involve using a computer to discover patterns in data and are often using in clustering or classifying applications. An example of a specific algorithm named “K-means Clustering” is shown above.
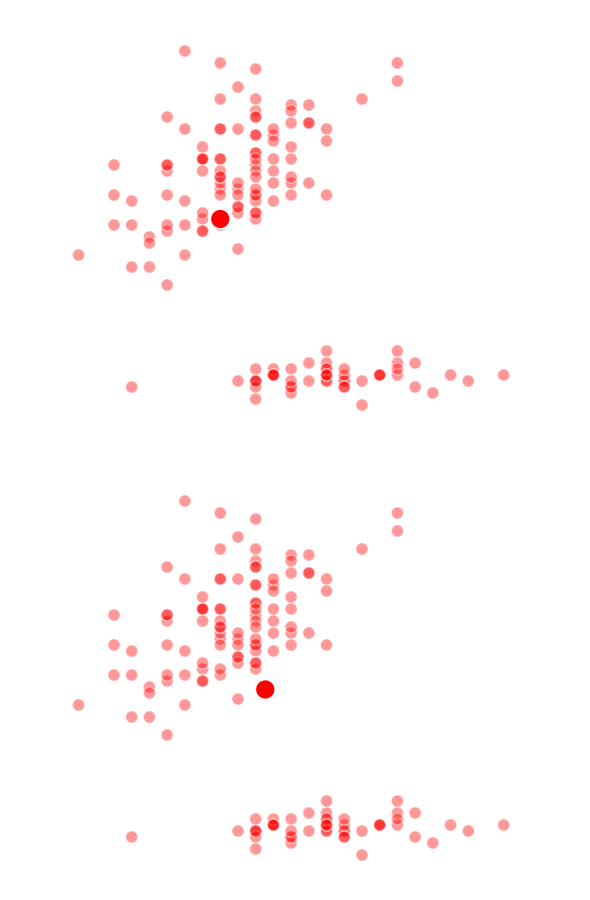
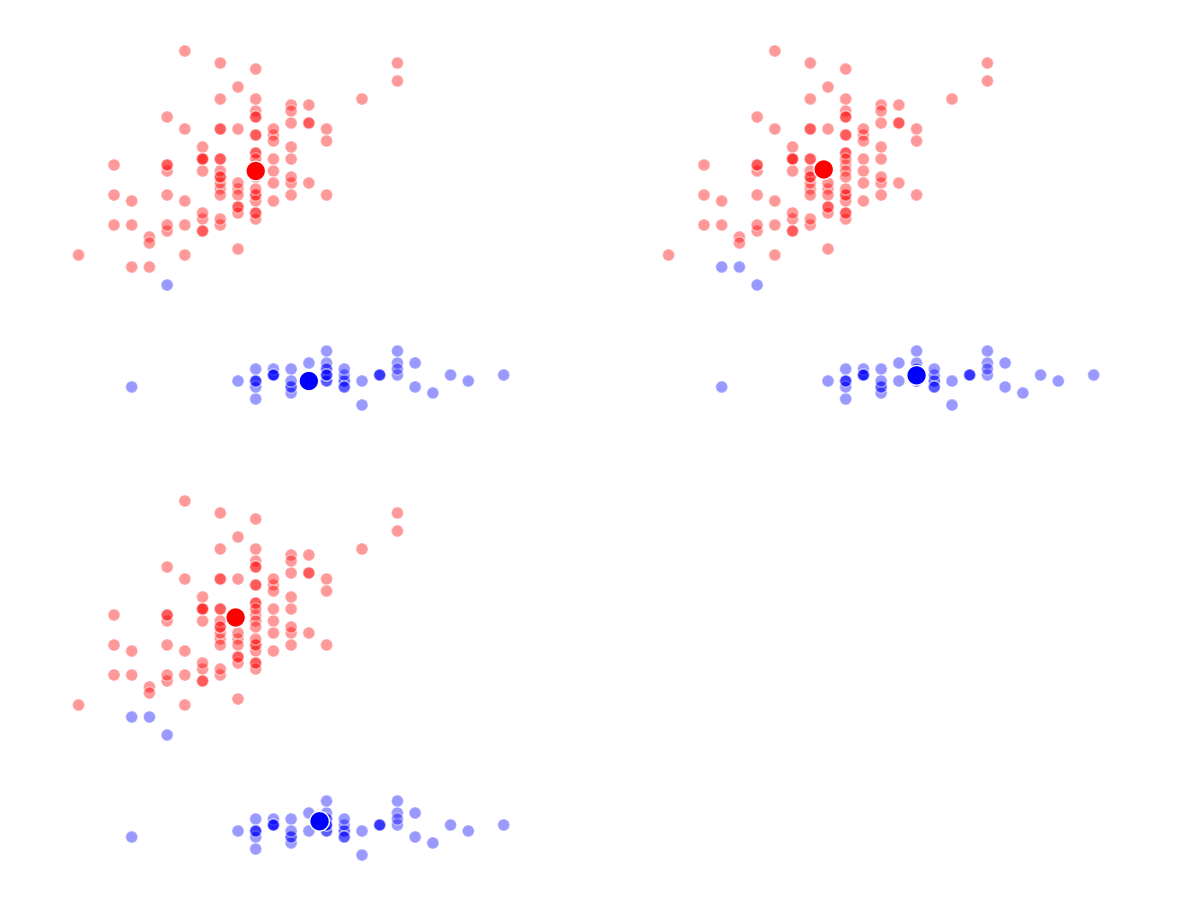
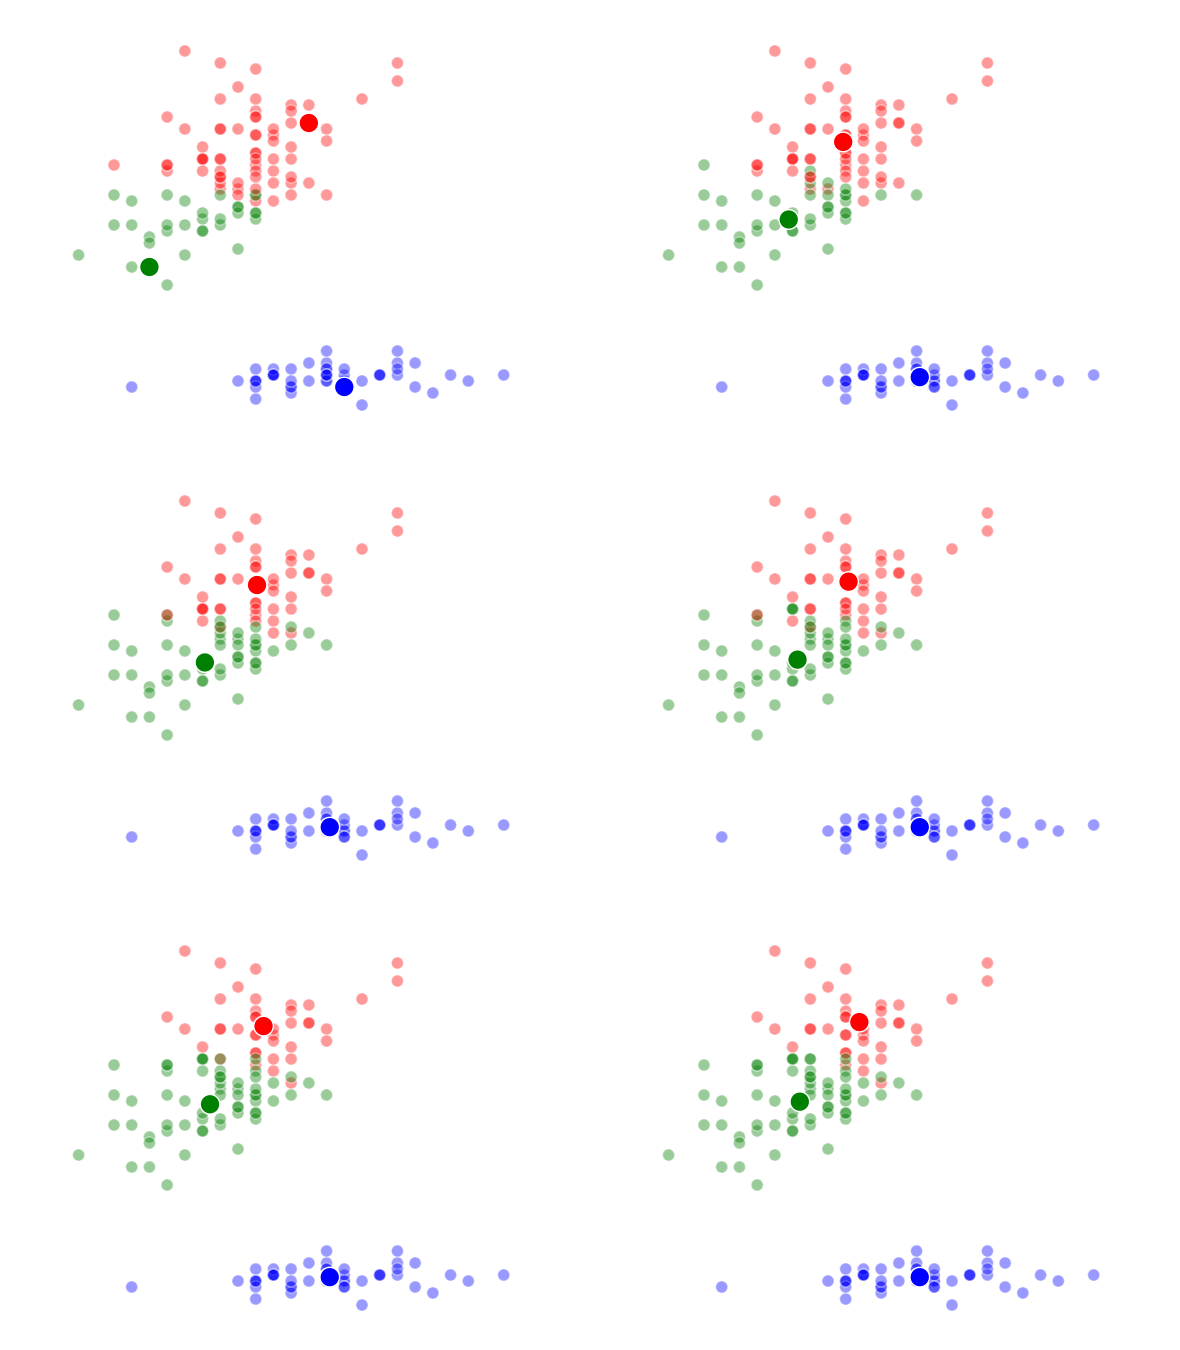
The way K-Means works is you take some set of data and tell the algorithm how many clusters (K) you think might be present. This can be done systematically or explicitly. The computer will then randomly place those K-cluster centers in the data and iteratively try to optimize the classification of the real data until you have the best optimized clusters possible. Optimization, in this case, refers to minimizing the euclidean distance between classified data points and their respective cluster centers as best as possible. Below, I’ve shown the results of K-Means clustering on the famous “Iris” data using K-values from 1 - 4. By eye, we can see that there is most probably 2 or 3 clusters present (humans are very good at pattern recognition) but we can tell the computer any number of clusters we want until the number of clusters is equal to the number of data points, at which point you will have classified each datapoint as it’s own class which is fairly useless.
K = 1 Clusters
K = 2 Clusters
K = 3 Clusters
–
K = 4 Clusters
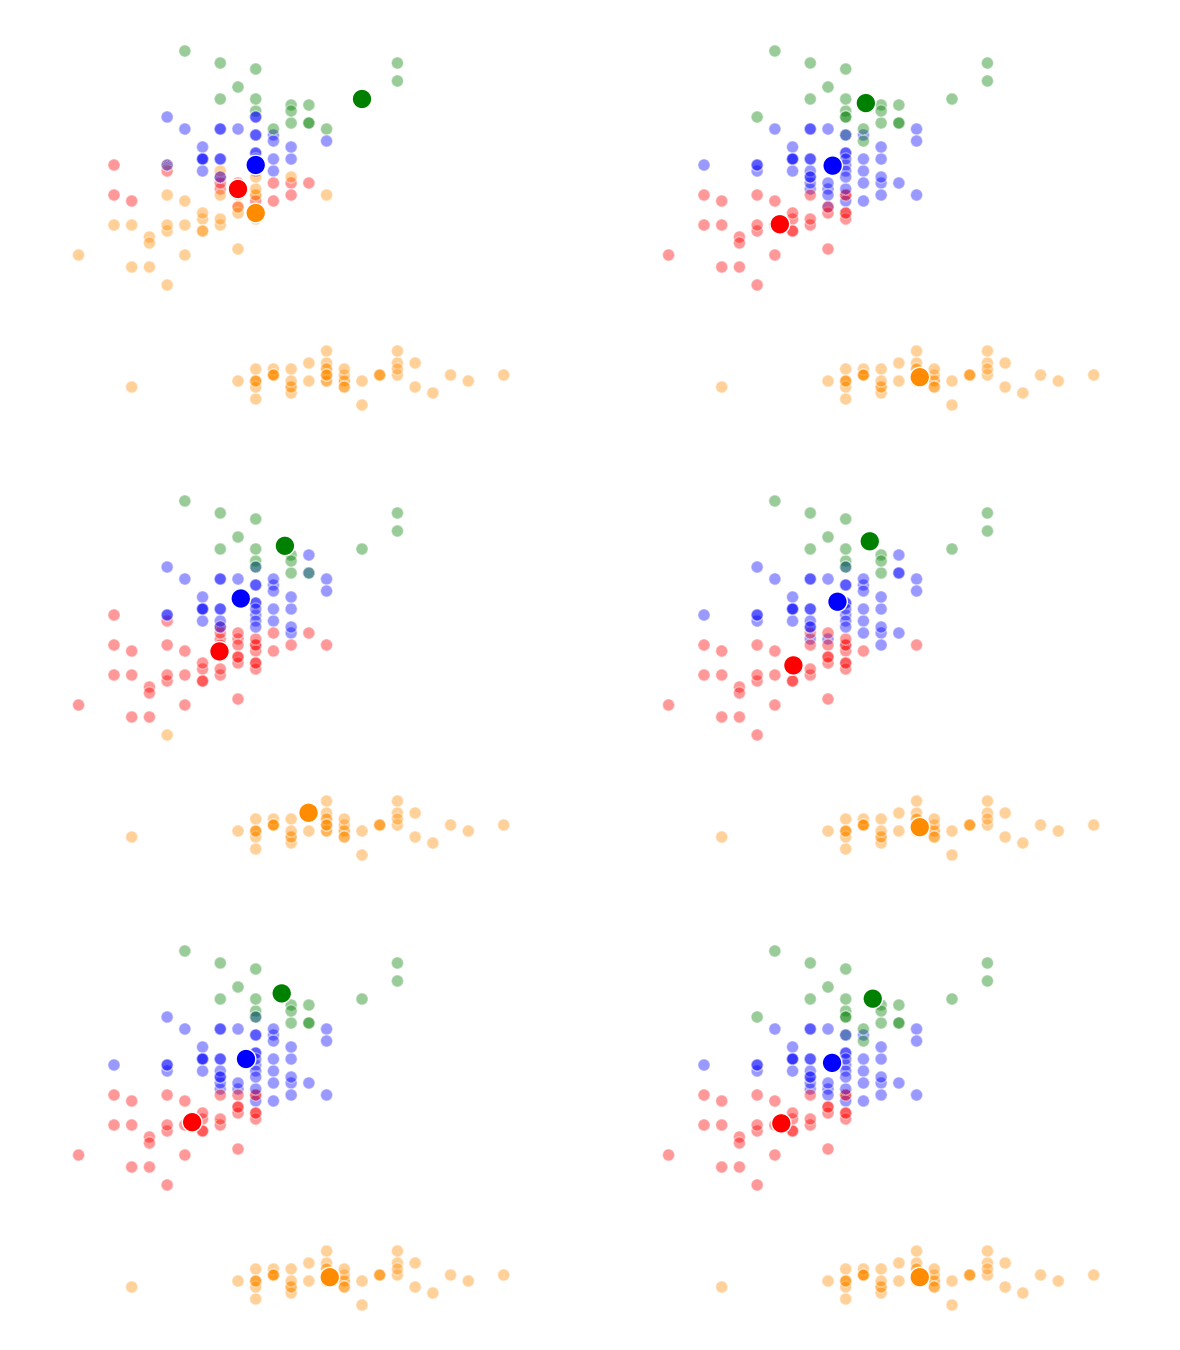
This was a pretty fun little exercise, and I enjoyed building the different visualizations using both python’s matplotlib and an fantastic command-line tool called ImageMagick (thank you Denis) to make the animations. I’ve made the class file and documentation for my code available on github if anyone is interested.
Matrices and Recommendation Systems
Apart from unsupervised methods, we again went back to linear algebra to learn a number of matrix factorization and dimensionality reduction techniques. The gist of these methods is that we can use matrix math to discover latent features in data, or to fill in unknown values with good estimates. Ever wonder how Netflix or Spotify recommends items to you? Matrix factorization is what it boils down to. Here’s an great and very accessible article on the topic from the Atlantic: How Netflix Reverse Engineered Hollywood.
Case Study: For this week’s case study, we built a joke recommender using the Jester Dataset. This is a dataset of 150 jokes with about 1.7 million ratings from 60,000 users. Our task was to best estimate the jokes that new users would score highly. My team used a GridSearch to cycle through a number of different parameters to best optimize our recommender system.
Next Week: Big Data Tools