Week 5 - There's MongoDB in my Beautiful Soup
28 Jun 2016Who comes up with these names???
This week we touched on all sorts of topics. We started off studying data science for business, looking at how to translate different models into profit curves. We then moved onto web scraping (yes, that is the proper terminology). This is one of my favorite parts of data science. Using just a few lines of code, you are able to grab information, automatically from the internet and store them for further use. We used the Beautiful Soup library to scrape thousands of New York Times articles into a MongoDB database. The web scraping part is awesome, I found the MongoDB database pretty confusing, mostly because it’s written in Javascript which is a language I have very little experience with.
Natural Language Processing
After extracting all this text data, we naturally had to come up with ways of doing text analysis; a field called ‘Natural Language Processing (NLP)’. Like everyday, the instructors at Galvanize smashed an insane amount of material into one day. I’m still trying to process it all but basically it boils down to NLP is a difficult field since words in different arrangements or with different punctuation can have different meanings and connotations.
Let's eat Grandma. Let's eat, Grandma.
There are operations you can do to make NLP more successful, dropping suffixes and word simplification (i.e. car, cars, car’s, cars’  car) is one example. But it is still a developing field with lots of progress to be made. For our assignment, we were asked to analyze how similar various articles from the New York Times were from each other.
Time Series
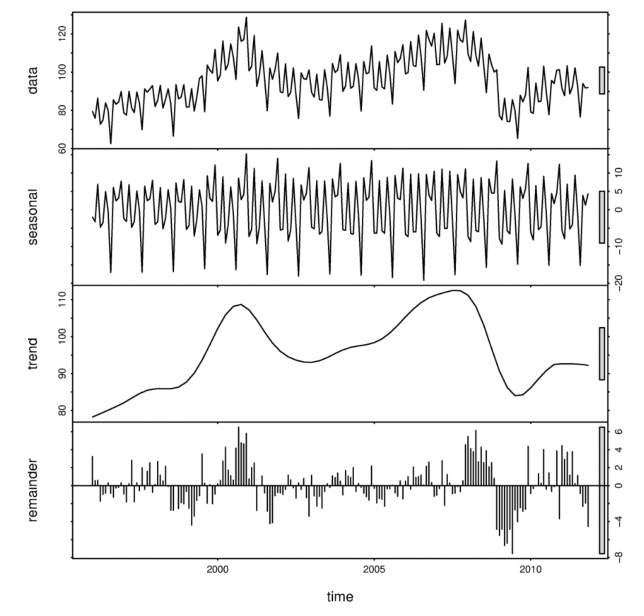 Example of time series data (top) broken down into ‘seasonal’, ‘trend’, and ‘white noise’ components.
Finally, we studied Time Series. I’ll admit that by this point in the week I was pretty much mentally checked out. I liked Time Series though, it was all about decomposing your signal into multiple ‘subsignals’. For example, let’s take temperature. At the scale of a day, the temperature goes up and down with the sun. At the scale of a year, the temperature goes up during summer and down in the winter. And if we were to look at the even larger, multi-year scale, we’d see an overall up-trend, because … global warming. If you have a good model, you should be able to capture the trends and the different cyclical components, leaving behind only white noise. In practice, this is quite difficult.
On the final day of the week we did a day-long analysis using data from a ride-sharing company (think uber or lyft). Using real data, we were able to predict customer ‘churn’ (when a customer leaves a company) and make recommendations for how to retain and build a customer base. My team built a Logistic regression model and Random Forest to capture and analyze these data.
The week ended with a much needed happy hour.
Thanks for hanging in there with me.
Next up: Unsupervised Learning + Capstone Ideas